
Follow the Oil Spill Data
Air Date: Week of May 5, 2017
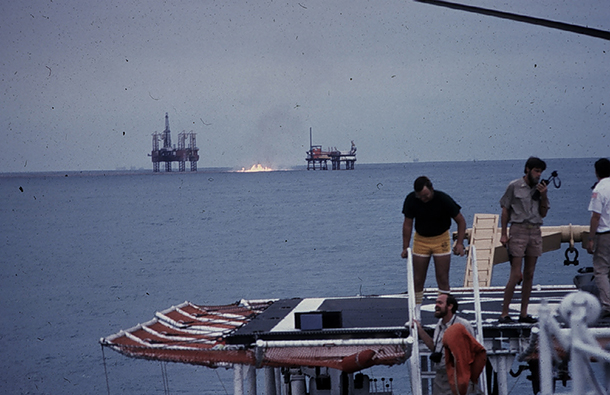
The Ixtoc oil well blowout from a helicopter platform in the Bay of Campeche, Mexico. (Photo: NOAA)
To grasp the long-term effects of the 2010 Deepwater Horizon oil blowout, a team of U.S. and Mexican researchers is examining the Ixtoc oil spill off the Mexican coastline in 1979. David Levin reports on how researchers turned satellite data from the 70s into a map of exactly where all of that oil traveled.
Transcript
PALMER: The destruction an oil spill in the Arctic could create was given sharp focus by the 2010 Deepwater Horizon well blowout in the Gulf of Mexico. It gushed nearly five million barrels of oil and broke all records, including one set by a 1979 spill off Mexico at the Ixtoc well that lasted nine months. Now a team of U.S. and Mexican researchers is revisiting Ixtoc to find out how the environment nearby has recovered, and learn how the area near Deepwater Horizon might look in the future. Their first step: some digital archaeology, dusting off satellite data from the late 1970s. David Levin has this report.
LEVIN: Studying an oil spill that happened nearly 40 years ago isn’t so easy, even one the size of the Ixtoc disaster. And that’s mainly because nobody’s really sure where all that oil went. In 1979, there was no way to map the spill, so millions of barrels went unaccounted for.
MURAWSKI: I haven’t seen any comprehensive maps that were drawn in the day.
LEVIN: That’s Steve Murawski, Professor at the University of South Florida’s College of Marine Science. He helps lead a group of scientists in the US and Mexico that are looking back at Ixtoc today. There’s really not much information on Ixtoc. By contrast, Deepwater Horizon was measured by multiple satellites, dozens of ships, and aircraft,
MURAWSKI: Deepwater Horizon was absolutely a unique event in terms of the amount and diversity of resources that were available to actually do this tracking. Y’know, people wanted not only to see the imagery at the wellhead, but they also wanted to know where it was, so that people could make up their own minds about the risk of oil coming ashore in different places.
LEVIN: In the 70s, though, that level of detail wasn’t even a possibility.
HU: [LAUGHING] No, no way.
LEVIN: Chuanmin Hu is an optical oceanographer at USF. He uses satellites to study modern oil spills. He says, the advantage is that a single satellite image lets him survey the entire Gulf of Mexico in one shot.
HU: Think about, if you want to do that with aircraft, it would take days or even months to have one complete view of the gulf, not to mention a boat. It takes years for a boat.
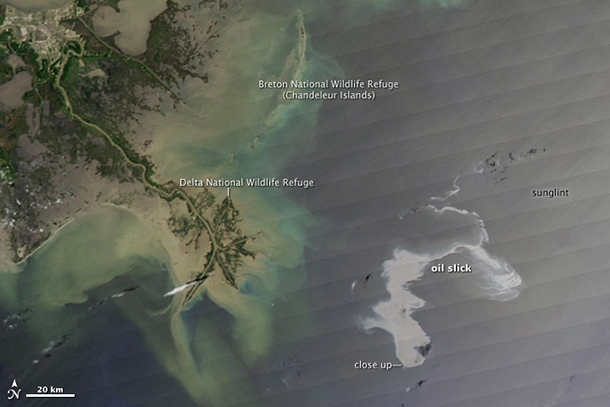
The Deepwater Horizon Spill in 2010 was extensively captured by modern satellite imagery. This image was taken by a Moderate Resolution Imaging Spectroradiometer (MODIS) on NASA’s Aqua satellite. (Photo: NASA Goddard Space Flight Center, Flickr CC BY 2.0)
LEVIN: Back in 1979, though, a handful of planes and boats were pretty much all first responders had to work with. But what cleanup crews didn’t know was that a few hundred miles overhead two early satellite instruments were busy clicking away.
The first was the Landsat Multispectral Scanner, basically a sort of digital camera in orbit. The second was the Coastal Marine Color Scanner, or CZCS.
HU: At that time, satellites were just launched. You know, very few people knew how to use them.
LEVIN: And because of their orbits, they didn’t fly over the Gulf of Mexico that often. CZCS took measurements of the Gulf just once every four days.
HU: For the other sensor, every 16 days you have a measurement.
LEVIN: And that didn’t mean the measurements were even usable.
HU: Exactly. There’s no guarantee you have cloud-free data. On average in the Gulf of Mexico, the odds of having cloud-free measurement is one over three. So basically if you have three images a day, then you may have a cloud-free measurement.
LEVIN: But even with these limitations, Hu thought the old data might still come in handy. If he and his team could use it to piece together images of the Gulf from 40 years ago, they might be able to make a basic map of where oil traveled during Ixtoc, one that could help Steve Murawski’s team figure out which areas to to study first.
So Hu and his students revisited the old satellite files. They’re actually not that hard to get, just visit the NASA website.
HU: So everybody, not just from this country, but around the world, has access to that data. So that’s public domain. How you process the data, that’s the challenging part.
LEVIN: It means turning raw data from the satellites into an image, then figuring out which region of the Gulf it’s actually showing. And then, you’ve got to figure out if there’s any oil in the water, which isn’t always obvious.
HU: So the first thing is to look at contrast on the ocean surface. So any outstanding features, that’s a suspicious feature.
LEVIN: Hu says you can tell at a glance if the image just shows clouds, or stuff floating on the surface. But you can’t easily tell if the material on the water is algae, oil, or something else. To do that, you have to analyze the subtle colors of light being reflected and absorbed.
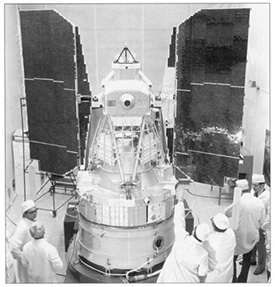
ERTS-1 -- The first Landsat satellite. (Photo: NASA)
HU: These well-designed sensors measure the different colors reflected from oil, from non-oil, and from other things in the ocean. And they each have different color shade measured by the sensor. So oil has a different shade than others, although your eyes can barely tell the difference.
LEVIN: So Hu’s grad student, Shaojie Sun started poring over all the data. He figured out — slowly — which measurements showed oil instead of clean seawater, and over the course of a few months, he squeezed out enough information to make this. A map.
SHAOJIE SUN: So I have a map of the Gulf of Mexico. In the lower left, the brownish color maps the Ixtoc oil spill.
LEVIN: On his computer screen, Sun points to a swirling brown streak near the Mexican coastline. It represents where oil traveled over nine months in 1979. In other words, it’s the first map ever to be made of the Ixtoc spill, nearly four decades after the well was plugged.
SHAOJIE SUN: It’s really exciting to map out a 40 years old oil spill, but other scientists can use my map and my work to do their own science.
LEVIN: Scientists like Steve Murwawski. He sees the work as a goldmine.
MURAWSKI: We looked at the map that we got from the satellite imagery as a treasure map. It’s incredibly valuable from a scientific point of view. And that treasure map has basically told us where to look for concentrations of oil, both on the bottom and also ashore in the shoreward areas.
LEVIN: Murwaski says that by dusting off old data, Shaojie Sun and Chuanmin Hu have created something entirely new, a tool that lets scientists revisit the past. It’s made possible the work that Murawksi and his team are doing on Ixtoc.
MURAWSKI: Mmm hmm, yeah. The new map that we have gives us not only a mosaic of what happened over nine months, so we can see the full footprint, but it also gives us some time slices of how that oil spill evolved over time.
LEVIN: The joint US-Mexican team is using Sun and Hu’s map to plan out where to take samples along the Mexican coast. They’re pulling bits of mud from the seafloor, collecting worms and other creatures living there, and they’re analyzing the water surrounding them, all based on the guidance they’re getting from 40 year old satellites. What they find now will help them understand the impact of Deepwater Horizon four decades in the future and tell whether the next generation of Gulf residents will still be feeling its effects.
For Living on Earth, I’m David Levin.
Links
This piece is part of the PRX series The Loop
Living on Earth wants to hear from you!
Living on Earth
62 Calef Highway, Suite 212
Lee, NH 03861
Telephone: 617-287-4121
E-mail: comments@loe.org
Newsletter [Click here]
Donate to Living on Earth!
Living on Earth is an independent media program and relies entirely on contributions from listeners and institutions supporting public service. Please donate now to preserve an independent environmental voice.
NewsletterLiving on Earth offers a weekly delivery of the show's rundown to your mailbox. Sign up for our newsletter today!
![]() Sailors For The Sea: Be the change you want to sea.
Sailors For The Sea: Be the change you want to sea.
 The Grantham Foundation for the Protection of the Environment: Committed to protecting and improving the health of the global environment.
 Contribute to Living on Earth and receive, as our gift to you, an archival print of one of Mark Seth Lender's extraordinary wildlife photographs. Follow the link to see Mark's current collection of photographs.
 Buy a signed copy of Mark Seth Lender's book Smeagull the Seagull & support Living on Earth
© Copyright World Media Foundation. All Rights Reserved
Home | Contact | RSS | Donate | Newsletter