Mapping the World’s Forests
Air Date: Week of November 22, 2013
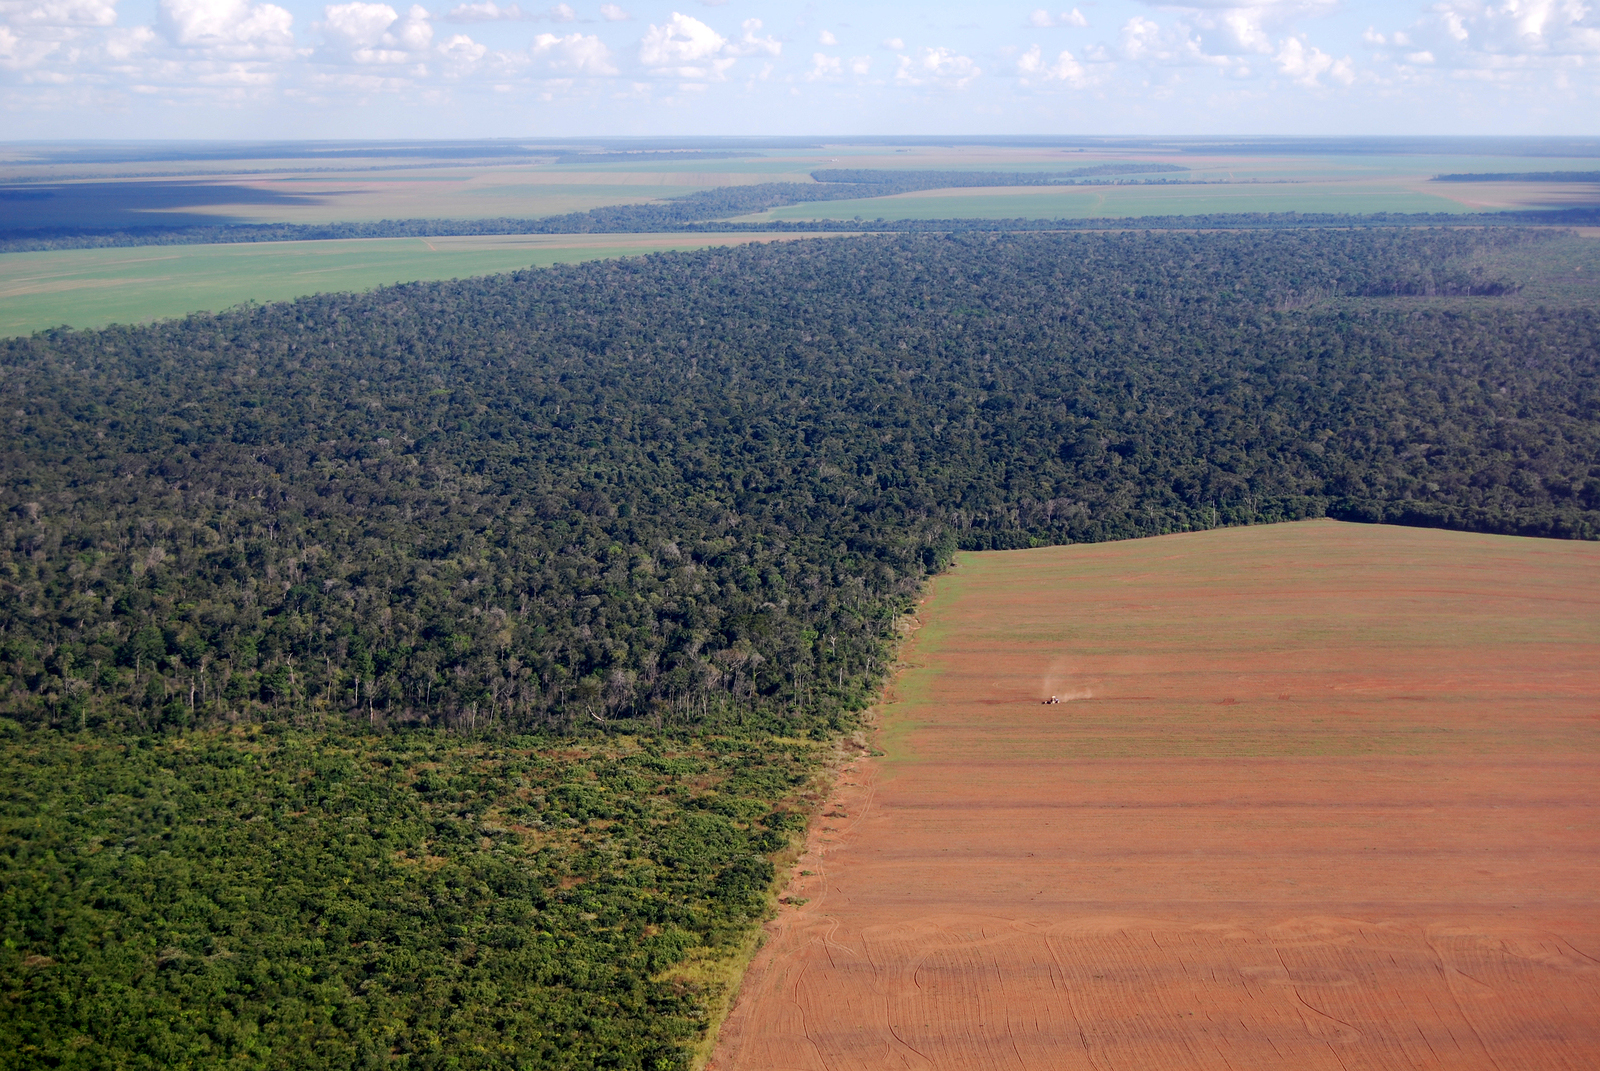
Deforestation clears land for soy production in Brazil (photo: bigstockphoto.com)
Any new international climate agreement is expected to include REDD—the reduction of emissions from forest degradation and destruction. Tropical forest losses accounts for about a fifth of all global carbon dioxide emissions, more than all transportation. A new endeavor using Google Earth has created the first high-resolution map of global forest cover change. Matt Hansen from the University of Maryland tells host Steve Curwood that the maps revealed some surprising discoveries.
Transcript
CURWOOD: If any new international climate agreement is ever worked out, it's expected to include REDD, a deal to reduce emissions from forest degradation and destruction.At the moment, loss of tropical forests accounts for about a fifth of all global carbon dioxide emissions, more than all transportation. And to forge a deal, there will need to be measurement and verification of what’s happening on the ground. Now negotiators and conservationists have a new tool: a collaboration that includes GoogleEarth, NASA, USGS, the University of Maryland and the Woods Hole Research Center that has produced the first high resolution map of global deforestation. Matt Hansen, of the University of Maryland was the lead author of a paper in Science that presented the project. Welcome to Living on Earth.
HANSEN: Thank you very much for having me.
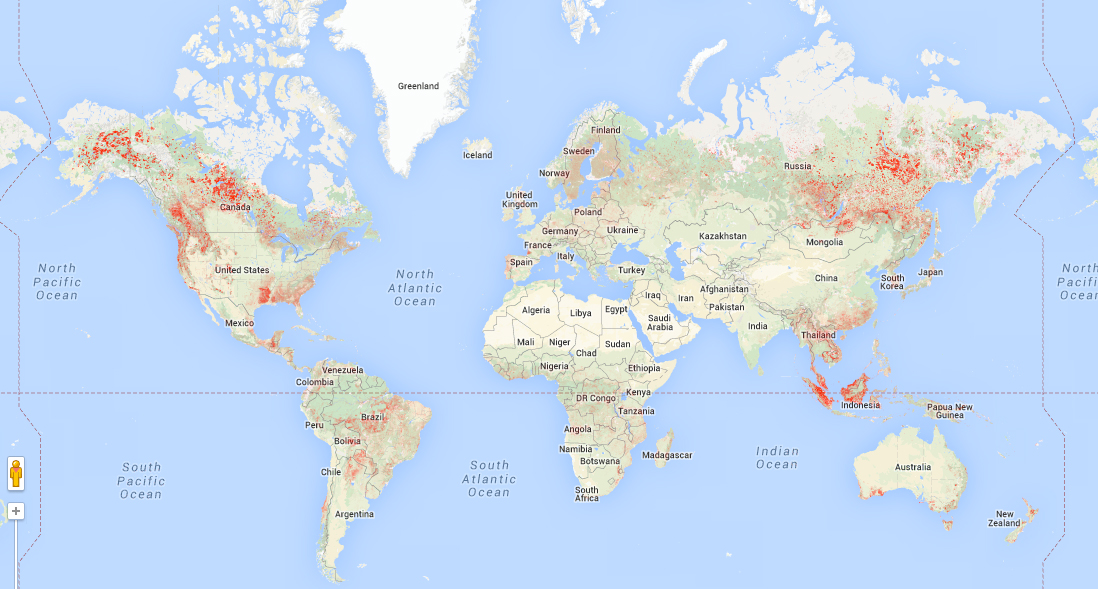
Forest cover change is represented in red. (Hansen, Potapov, Moore, Hancher et al., 2013)
CURWOOD: So this is an interactive map of forest cover around the world. How exactly does this work?
HANSEN: Well, the interactive map is fantastic in that it allows people to see the results of our study. The map is this great global overview where you can look at the patterns and density and tree cover, and on top of that look at the losses and gains over the 12-year-period that we produced this map, and at the same time you can take the roller button on your mouse and zoom down to a 30 meter square on the Earth and see what happened to that particular patch of ground. So we promote it as a globally consistent locally relevant product, and we can go down and look at individual clearings.
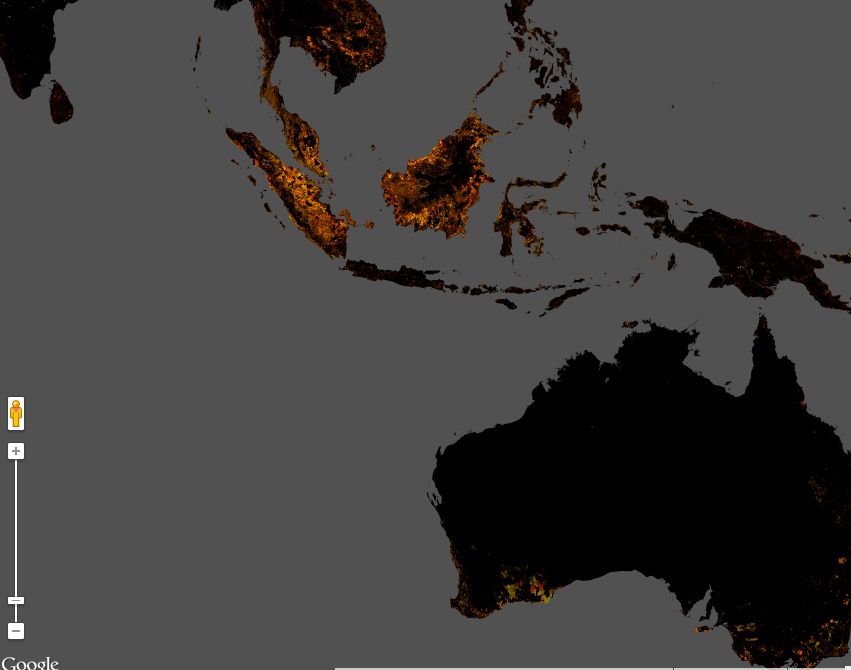
Deforestation in Indonesia is represented in orange. Hansen, Potapov, Moore, Hancher et al., 2013)
CURWOOD: Now where did you get the data to make these maps?
HANSEN: These maps are based on a Landsat 7 satellite. Landsat is a long running series of satellites jointly operated by NASA and USGS. Starting in 1999, this particular Landsat was systematically acquiring images everywhere. Once you have it updated everywhere, you can start thinking about mapping everywhere. And then the other thing that had to come together was high-performance computing. Once they open up the archive, we’re like, wow. OK. Now how do we query and process hundreds and thousands of these images, and when we did it in the GoogleEarth engine highly parallelized environment, what would have taken 15 years on one CPU took a few days.
CURWOOD: So what kind of data did we have before this was available? I’m thinking of places like tropical forests in Africa, Congo, where government isn’t able to collect this type of information.
HANSEN: Right. Well, that’s where it’s most valuable. If you have the view from space on a place where there is no forest inventory being collected, these data are really valuable so that’s what we’ve always promoted. We’ve been working on the Congo Basin for 15 years, and we’ve produced this type of data there, in Indonesia, and the like. But the only country that produces annual data like this is Brazil, and they release the data. Other countries use remote sensing, but they don’t openly share the data. Thinking more of Indonesia; Indonesia has the capability, they don’t share their data so well; it’s very hard to tease out what’s really happening in Indonesia.
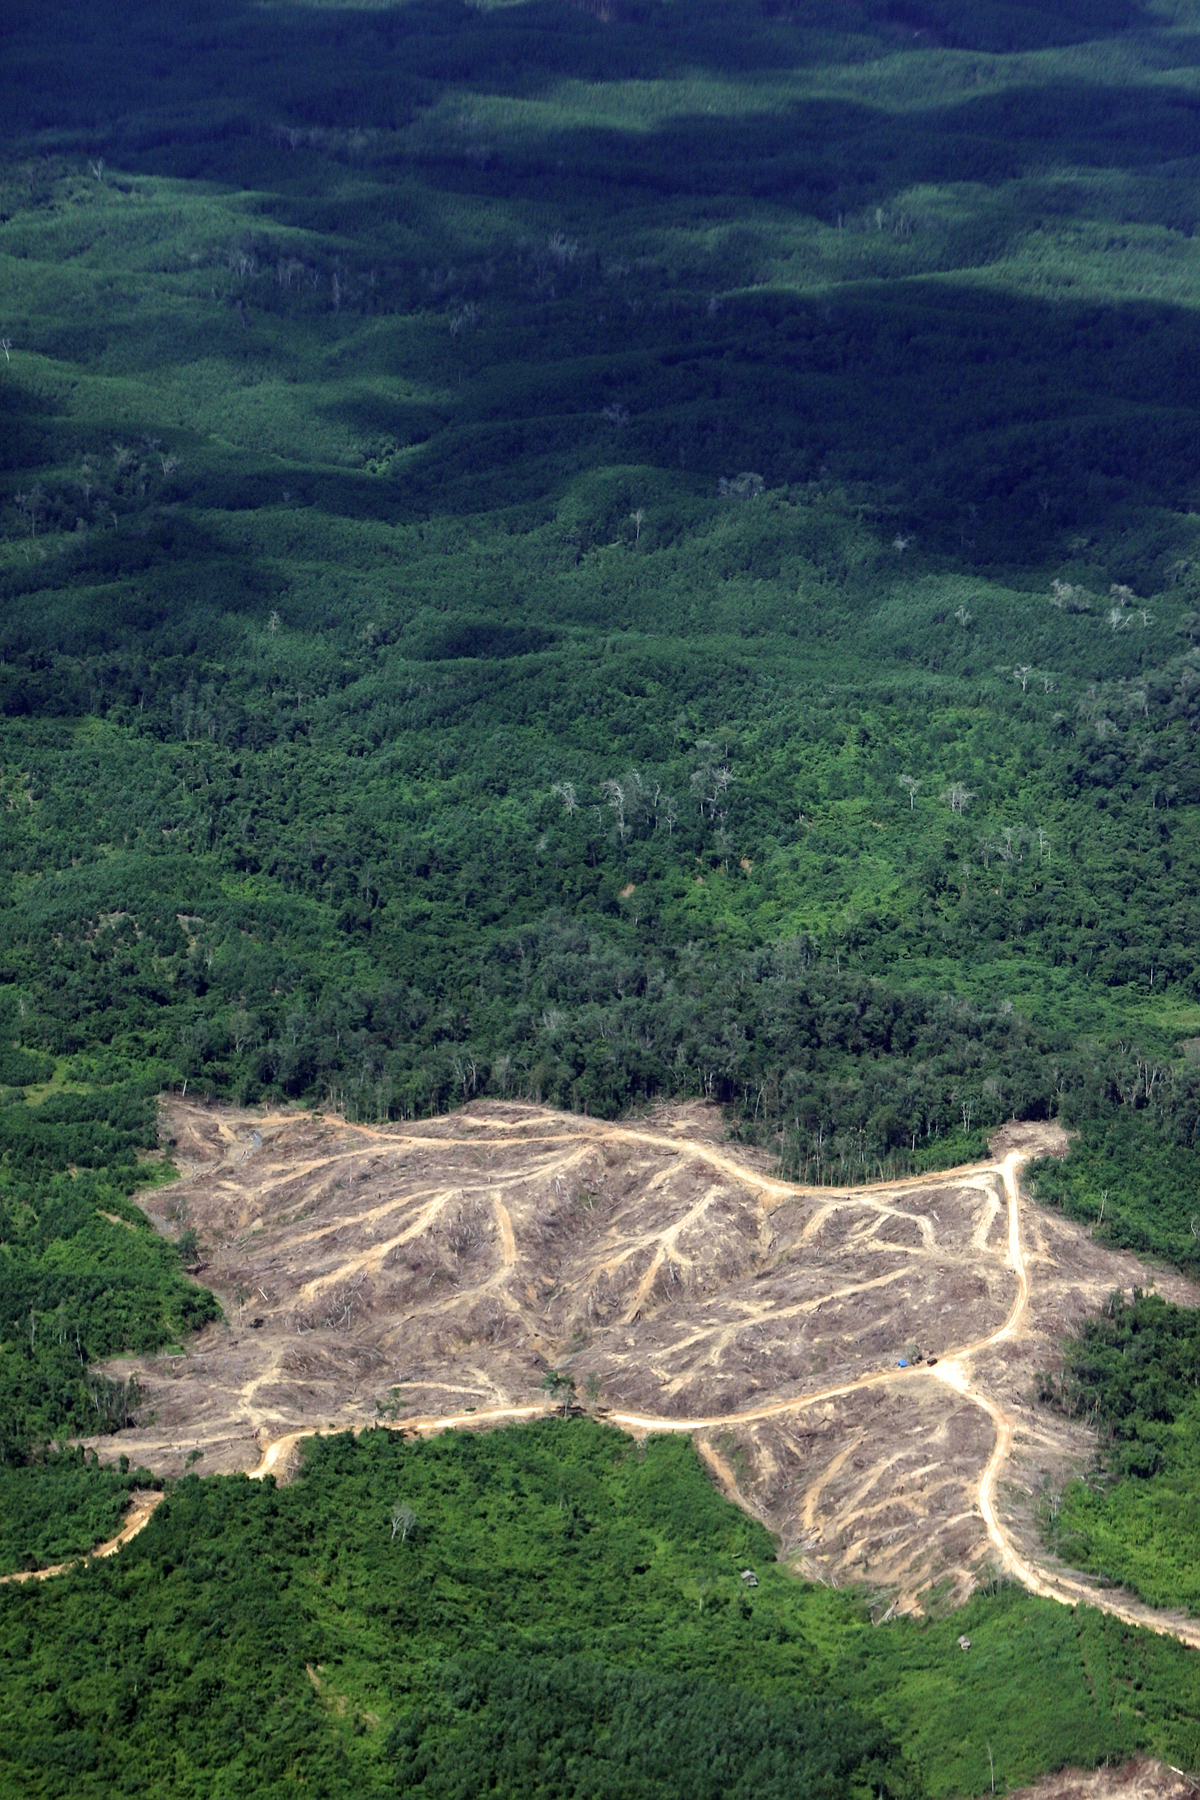
Deforestation in Borneo (photo: Bigstockphoto.com)
CURWOOD: I looked at your map and zoomed in on Indonesia...wow. Look how much deforestation has increased there in the last 12 years.
HANSEN: Yes. Indonesia was, in our study, the most annual increase, about 1,000 square kilometers additional per year of the study period, that is the appropriation of natural forest for higher order of use like palm oil or pulp.
CURWOOD: Deforestation on the rise in Indonesia. Where else are you seeing it on the rise?
HANSEN: In Malaysia, they are really converting their natural forests, and when you look at the middle of Borneo, you see this line where the logging roads in Malaysia go right up to the borders, so the intensity of forest logging and conversion in Malaysia is much higher than in Indonesia. If you look at the Chaco from Bolivia to Paraguay and Argentina there’s all loss, no gain. It is a deforestation dynamic converting almost an entire eco-region in a period of 20-30 years to pasture lands and soybean production, even small isolated events. We had one changed pattern in China that we couldn’t figure out. It looked like noise. We thought there was a problem with the data, but it was actually forests sliding off of a mountain range west of Chengdu. In 2008 they had the Sichuan earthquake and these forests literally slid off the mountain tops and it’s a very strange pattern, but it’s a true pattern. So there’s all kinds of things going on in these data, but a lot of it is tropical. The rates have increased in tropics is the most arresting, I would say.
CURWOOD: Looking at west Africa, a lot of hotspots there too.
HANSEN: West Africa, the main hotspot is Cote d’Ivoire. Cote d’Ivoire in the last 12 years has gone through two civil wars. In this period of instability, there’s been a large conversion of a lot of protected areas, national parks and forest reserves, so these big patches, these big polygons of forest, and it tells you how fragile national and natural heritage can be. You might set aside 20 percent of your lands for protected areas, but if you go through a bad period, you could lose it. On the positive side, you can see a big forest block. It’s the iconic forest of west Africa, that’s Taï National Park, that’s a World Heritage Site, and that’s intact. It’s in Cote d’Ivoire. It survived all this instability. It’s where they filmed the Disney movie Chimpanzee and it looks great.
CURWOOD: Of course, the vast majority of trees are in the tropics, but I noticed when I went to the southeastern United States, there was a lot of deforestation going on there. What’s happening in this country?
HANSEN: The southeast United States, it’s a tree farm, basically. The forestry land use is very intensive, and trees are grown and harvested for pulp and timber purposes. It’s not deforestation, but it does have implications on habitat and other ecosystem services, whether it’s carbon or water cycle. When you look at the landscape, you try to find an intact habitat, and you’re going to look long and hard because it is a really really intensively disturbed and used landscape.
CURWOOD: Why is it important to have a map like this?
HANSEN: We can use it regionally to model hydrology effects on biodiversity, people use our maps in ways that we can’t imagine. Someone used a map of ours - forest cover in Malawi relating dietary diversity to health outcomes and people that have access to tree cover had more diverse diets and better standards in terms of health, so we are really excited that when we get this data out, people use it at a global scale, they use it at a local scale, they’re use it for predictable science applications, and some we haven’t even anticipated.
CURWOOD: Matt Hansen is a Professor of Geographical Science at the University of Maryland. Thank you so much, Sir.
HANSEN: Thank you.
Forest loss in Indonesia
Deforestation in Paraguay
Links
Living on Earth wants to hear from you!
Living on Earth
62 Calef Highway, Suite 212
Lee, NH 03861
Telephone: 617-287-4121
E-mail: comments@loe.org
Newsletter [Click here]
Donate to Living on Earth!
Living on Earth is an independent media program and relies entirely on contributions from listeners and institutions supporting public service. Please donate now to preserve an independent environmental voice.
NewsletterLiving on Earth offers a weekly delivery of the show's rundown to your mailbox. Sign up for our newsletter today!
![]() Sailors For The Sea: Be the change you want to sea.
Sailors For The Sea: Be the change you want to sea.
 The Grantham Foundation for the Protection of the Environment: Committed to protecting and improving the health of the global environment.
 Contribute to Living on Earth and receive, as our gift to you, an archival print of one of Mark Seth Lender's extraordinary wildlife photographs. Follow the link to see Mark's current collection of photographs.
 Buy a signed copy of Mark Seth Lender's book Smeagull the Seagull & support Living on Earth
© Copyright World Media Foundation. All Rights Reserved
Home | Contact | RSS | Donate | Newsletter